 |
Overview
Understand safety performance, compare audit results and monitor linked actions
The Safety Audit Dashboard brings together completed audit results and the issues raised from those audits. It gives project and safety teams a consistent view of audit activity, scoring, compliance and follow-up actions across projects and reporting periods.
Use the summary pages to identify changes in performance, then select a project, audit, section or chart value to narrow the other visuals and investigate the detail behind the result.
- Purpose: [What is this guide about?]
- Who It’s For: [General users, admins, project teams, etc.]
Prerequisites: Use this guide to understand what each dashboard page shows, apply the available time and project filters, interpret audit scoring, and move from summary results into individual audits and their linked issues.
TABLE OF CONTENTS
- What can I use the dashboard for?
- Dashboard pages
- Using the dashboard
- Understanding audit scoring
- Audit Summary
- Audits Comparison
- Issues Overview
- FAQs & Troubleshooting
What can I use the dashboard for?
• Review the number of projects audited and audits completed during a selected reporting period.
• Compare average scores and compliance rates with the previous period and with all-time performance.
• Identify the best- and worst-performing projects within the current filter context.
• See which audit sections are performing well and which require further attention.
• Open an audit from the dashboard and review the user, team, date and status recorded against it.
• Review linked issues, responsible parties, priorities, due dates and close-out progress.
• Compare audit results by month and analyse issue patterns across projects.
Availability: The pages, fields and filters you can see may vary according to your organisation's dashboard configuration and your access permissions.
Dashboard pages
Page | What it is used for |
Audit Summary | A high-level view of audit activity, average score, compliance, trends and detailed audit records for the selected reporting period. |
Audits Comparison | A period-comparison view that allows a specific month or date range to be selected and compared across projects and sections. |
Issues Overview | An overview of issues linked to safety audits, including status, priority, project, responsible party and assigned team. |
Using the dashboard
Select a page
Use the page navigation controls on the left of the dashboard to move between the Audit Summary, Audits Comparison and Issues Overview pages. The active page is shown in the page title at the top of the report.
Apply filters and interact with visuals
- Choose a reporting period or use the available date controls to define the data you want to review.
- Select a project, section, status or chart value to filter related visuals on the page.
- Select the same value again, select a blank area of the visual, or use the clear-filter control to remove the selection.
- Use the expand and collapse controls in hierarchical tables to move between project and audit-section detail.
- Use horizontal and vertical scroll bars where a table contains more rows or columns than can be displayed at once.
- Use a visual's sort or focus controls where available to change the order or enlarge the visual.
Tip: Selections normally cross-filter the other visuals on the same page. Before drawing a conclusion, check whether a project, date or chart selection is still active.
Data refresh
The Refreshed date and time in the top-right corner shows when the dashboard data was last updated. Recent work may not appear until the next scheduled refresh.
Understanding audit scoring
The dashboard records an audit answer on a 0-4 scale and presents the result as a percentage. The percentage provides a familiar way to discuss performance while retaining the underlying score for detailed analysis.
Score | Score % | Compliance classification |
0 | 0% | Non-compliant |
1 | 25% | Non-compliant |
2 | 50% | Non-compliant |
3 | 75% | Compliant |
4 | 100% | Compliant |
Calculation: Score % = score / 4 x 100. For example, a score of 3 is shown as 75%, and a score of 2.5 is shown as 62.5%.
How is the compliance rate calculated?
Compliance rate measures the proportion of scored sections classified as compliant. Scores of 3 and 4 are compliant; scores of 0, 1 and 2 are non-compliant. The calculation counts compliant sections rather than weighting non-compliance by severity.
Example: If three sections score 0, 1 and 4, one of the three sections is compliant. The compliance rate is therefore 33%. The average score shows the degree of the scoring difference, while the compliance rate shows the proportion meeting the compliance threshold.
In this dashboard configuration, Advisory and N/A answers are treated as a score of 3 for scoring purposes. Their counts are shown separately so that users can see how often these answer types have been used.
Selected, previous and all-time results
Measure | Meaning |
Selected Period | The reporting period currently selected on the dashboard. |
Previous Period | The immediately preceding equivalent period used for comparison. |
All Time | The overall historic result available within the current project and dashboard filter context. |
Difference | Selected-period result minus the previous-period result. |
Trend | The direction and scale of movement between the selected and comparison period. A downward arrow identifies a reduction; an upward arrow identifies an increase. |
Audit Summary
The Audit Summary is the main performance page. It combines headline measures with project, section, time-series and record-level detail.
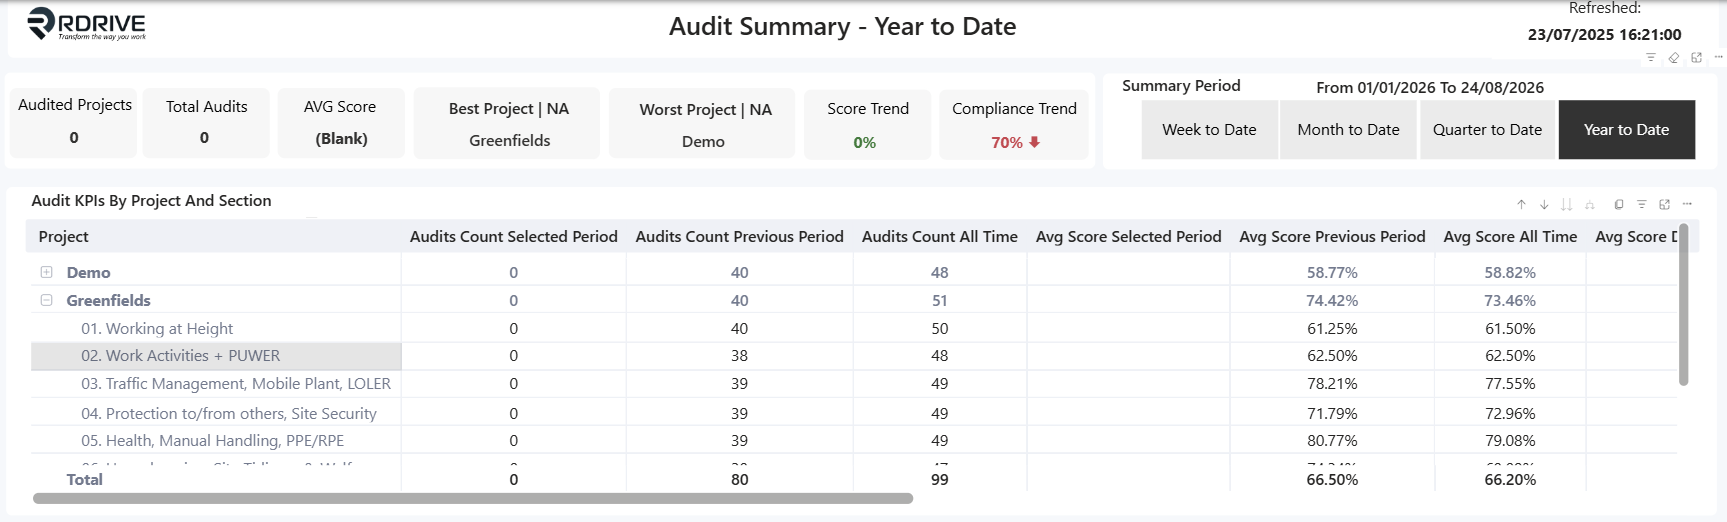
Example Audit Summary header, period controls and project/section KPI table.
Choose the summary period
Use Week to Date, Month to Date, Quarter to Date or Year to Date to change the reporting window. The From and To dates above the controls confirm the exact period being used.
Period | Typical use |
Week to Date | Review the latest audit activity and immediate changes. |
Month to Date | Monitor current-month performance and compare it with the preceding month. |
Quarter to Date | Review broader performance across the current quarter. |
Year to Date | Assess cumulative performance from the start of the year. |
Headline cards
Card | What it shows |
Audited Projects | The number of projects with audit activity in the selected period. |
Total Audits | The number of audits included in the selected period and current filter context. |
AVG Score | The average audit result, displayed as a percentage in the current dashboard. |
Best Project | The highest-performing project in the current filter context, together with its score. |
Worst Project | The lowest-performing project in the current filter context, together with its score. |
Score Trend | The change in average score compared with the previous period. |
Compliance Trend | The change in compliance rate compared with the previous period. |
Audit KPIs by Project and Section
This table compares audit volume, average score and compliance for each project. Expand a project to review its audit sections. Scroll horizontally to view the complete set of score, difference, compliance and trend columns.
- Audit counts for the selected period, previous period and all time.
- Average score for the selected period, previous period and all time.
- Average score difference and score trend.
- Compliance rate for the selected period, previous period and all time.
- Compliance rate trend.
Average Score by Project and Section
These charts compare the selected-period result with the previous-period and all-time result. Use the project chart to identify performance differences between projects and the section chart to identify common strengths or weaker audit topics.

Example Average Score by Section visual, including the overall average reference line.
Reading the chart: The reference line shows the overall company average. Bars below the line are performing below the company norm within the current filter context; bars above it are performing above the norm.
Score and compliance over time
The time-series visuals show how average score and compliance rate change between audit dates. Periods with no completed audit are omitted so that a lack of audit activity is not shown as a false drop to zero.
Score distribution
The Score % visual shows the proportion of audit answers recorded at each score from 0 to 4 for the selected, previous and all-time periods. Use it to understand whether a headline average is driven by a broad pattern or by a smaller number of very high or very low answers.
Drilling into audit detail
Use the detailed tables at the bottom of the Audit Summary to move from overall performance into the audits, sections and actions that produced the result.
Audit Details
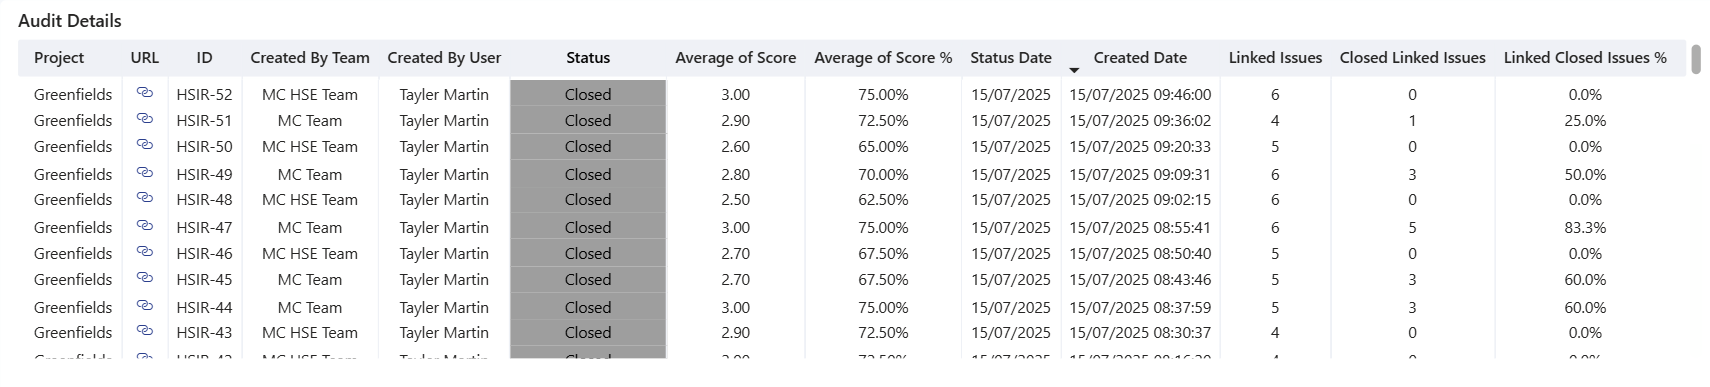
Example Audit Details table. Additional columns can be viewed using the horizontal scroll bar.
Field | Meaning |
Project | The project against which the audit was completed. |
URL | A link to open the audit record in RDrive. |
ID | The audit record identifier. |
Created By Team / User | The team and user associated with creating the audit. |
Status | The current audit status. |
Average Score / Score % | The audit's underlying average score and percentage equivalent. |
Status Date / Created Date | When the audit reached its current status and when the record was created. |
Linked Issues | The total number of issues linked to the audit. |
Closed Linked Issues | The number of linked issues that have been closed. |
Linked Closed Issues % | The percentage of linked issues closed. |
Audit Details by Section
This table breaks each audit into individual safety sections. Sort or select a low-scoring section to identify the audit records that need investigation.
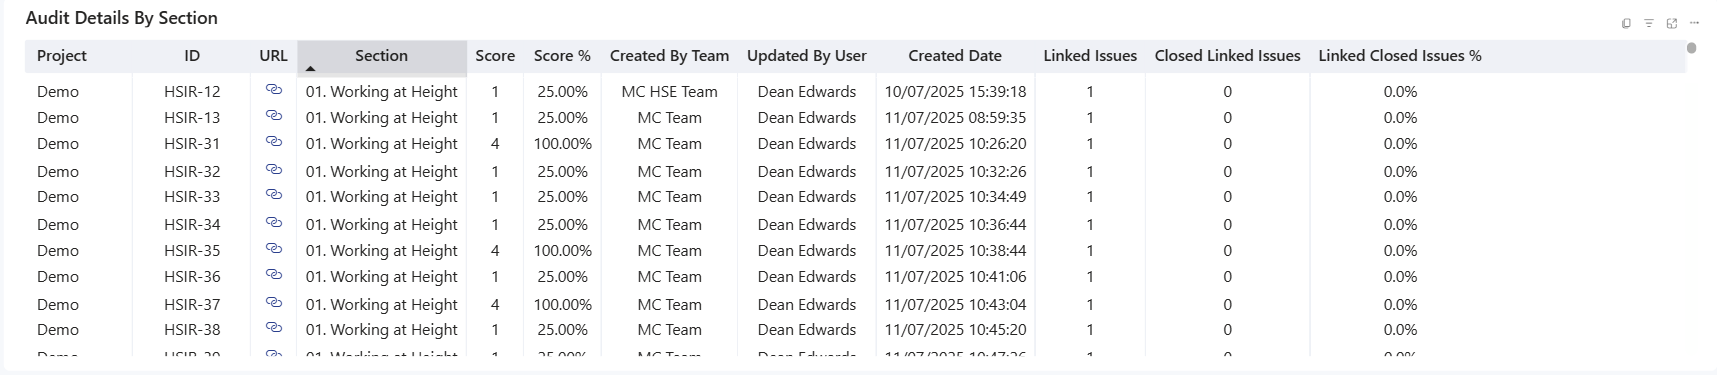
Example section-level audit detail. The user field identifies who updated the section where configured.
Field | Meaning |
Project / ID / URL | Identifies the parent audit and provides a link to open it. |
Section | The safety topic or inspection section being scored. |
Score / Score % | The section result on the 0-4 scale and its percentage equivalent. |
Created By Team | The team associated with the audit record. |
Updated By User | The user who updated the section, where this information is available. |
Created Date | The recorded date and time for the section response. |
Linked Issues | The number of issues linked to the audit or section context. |
Closed Linked Issues / % | The number and percentage of those linked issues that are closed. |
Linked Issues
Select an audit or section to filter the Linked Issues table to the actions raised from that record. Depending on the available data, the table can include the issue ID, link, photo, category, sub-category, created date, responsible party, priority, due date and inspection question or type.
Recommended workflow: Sort the audit or section table by score, select a low result, then review its linked-issue count and close-out percentage. Open the audit or issue using the URL link when you need the full record and supporting evidence.
Audits Comparison
Use Audits Comparison when you need to review a specific month or compare audit performance between periods. This is particularly useful when the standard week-, month-, quarter- and year-to-date selections are too broad for the question you are investigating.
How to compare audit performance
Step | Action |
1. Select the period | Choose the required month or use the available date control to define the period. |
2. Review the headline result | Check the audit count, average score and compliance measures for the selected period. |
3. Compare projects and sections | Select a project or section to filter the remaining visuals and compare performance. |
4. Investigate the detail | Use the audit-detail tables and links to open the records behind an unexpected result. |
5. Clear the selection | Remove active selections before starting a new comparison. |
Important: Always confirm the displayed From and To dates. A chart label such as Month to Date and a manually selected month may represent different date windows.
Issues Overview
Issues Overview focuses on the findings and actions raised from safety audits. Use it to monitor close-out, identify repeated themes and see where responsibility sits.
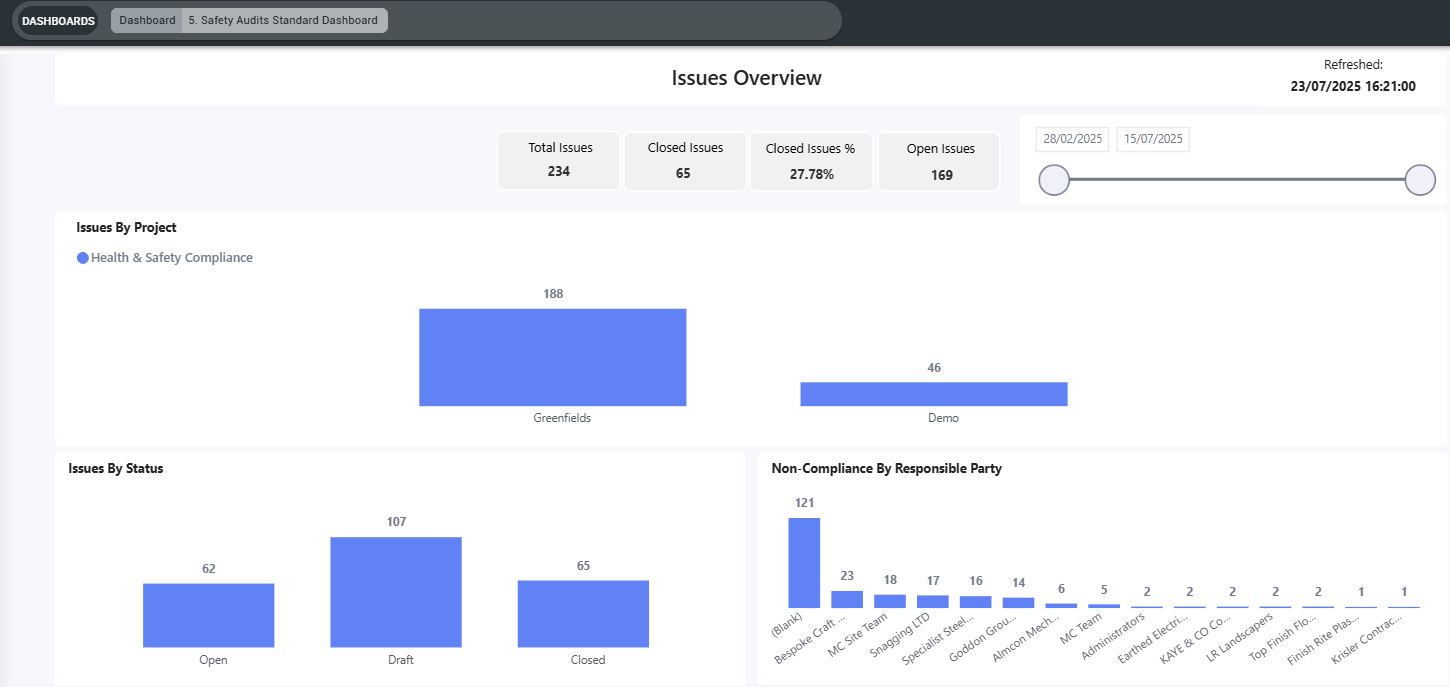
Example Issues Overview showing headline issue totals and breakdowns by project, status and responsible party.
Issue summary cards
Card | What it shows |
Total Issues | All issues included in the current date and dashboard filter context. |
Closed Issues | The number of included issues recorded as closed. |
Closed Issues % | The proportion of included issues that are closed. |
Open Issues | The number of included issues that remain open. |
Issue analysis visuals
Visual | How to use it |
Issues by Project | Compare the number of audit-related issues across projects. Where configured, use the series or legend to distinguish compliance records from non-compliance issues. |
Issues by Status | Review how many issues are open, fixed or closed and select a status to filter the page. |
Non-Compliance by Responsible Party | Identify which responsible parties hold non-compliance actions. Compliance photo records are not normally assigned to a responsible party. |
Issues by Priority | Understand the balance of issue priorities and focus on higher-priority actions. |
Issues by Assigned Team | Review which teams have been assigned audit-related actions. |
Compare issues by date
Use the date control on Issues Overview to compare issue activity between months or another required range. The comparison uses the issue Created Date. After changing the date range, confirm that the issue totals and all supporting visuals have updated before interpreting the result.
Suggested review workflow
Question | Where to look |
Are we completing enough audits? | Audit Summary: Audited Projects, Total Audits and audit counts by project. |
Is performance improving? | Audit Summary: Score Trend, Compliance Trend and time-series visuals. |
Which project needs attention? | Best/Worst Project, Average Score by Project and project rows in the KPI table. |
Which safety topic is driving the result? | Average Score by Section and Audit Details by Section. |
What happened in a specific audit? | Audit Details URL, then open the audit record in RDrive. |
Are corrective actions being closed? | Linked Issues, Closed Linked Issues, close-out percentage and Issues Overview. |
Who owns outstanding non-compliance? | Issues Overview: Non-Compliance by Responsible Party and Assigned Team. |
| How did a particular month perform? | Audits Comparison and its month/date selection. |
FAQs & Troubleshooting
Q: Why do my figures change when I select a chart?
A: Dashboard visuals interact with one another. Selecting a project, section, status or bar filters the other visuals on that page. Clear the selection to return to the full view.
Q: Why can I not see a recent audit or issue?
A: Check the selected date range, active project filters and the Refreshed timestamp. The record may fall outside the filter context or may not yet have been included in the latest refresh.
Q: Why are some table columns hidden?
A: Detailed tables are wider than the page. Use the horizontal scroll bar or focus mode to view the remaining columns.
Q: Does a lower non-compliant score carry more weight in the compliance rate?
A: No. Compliance rate counts whether each scored section is compliant or non-compliant. The average score provides the additional indication of severity.
Q: Can I open the source audit or issue?
A: Yes, where a URL or link icon is shown. Select it to open the relevant RDrive record, subject to your permissions.
Q: Why are there no values for a previous period?
A: There may be no audit activity in the comparison period, or the active filters may exclude it. Review the date range and remove any unintended selections.
Q: Can the dashboard show a specific month?
A: Yes. Use the Audits Comparison page and its month or date selection. Issues Overview also provides a date control based on issue Created Date.
Was this article helpful?
That’s Great!
Thank you for your feedback
Sorry! We couldn't be helpful
Thank you for your feedback
Feedback sent
We appreciate your effort and will try to fix the article